
hubgame:map
Differences
This shows you the differences between two versions of the page.
| Both sides previous revision Previous revision Next revision | Previous revision | ||
|
hubgame:map [2022/06/01 13:01] 2yf7j |
hubgame:map [2022/06/01 14:16] (current) 2yf7j |
||
|---|---|---|---|
| Line 15: | Line 15: | ||
| * [Ideas as developed in the game](http://networkedcity.london/hubgame/videos) | * [Ideas as developed in the game](http://networkedcity.london/hubgame/videos) | ||
| - | There is an analysis of the map below | + | There is an analysis of the map below (may be a problem with loading in Chrome) |
| {{url>https://embed.kumu.io/4695c3dd3a410d9b96249cc96193c01b}} | {{url>https://embed.kumu.io/4695c3dd3a410d9b96249cc96193c01b}} | ||
| Line 23: | Line 23: | ||
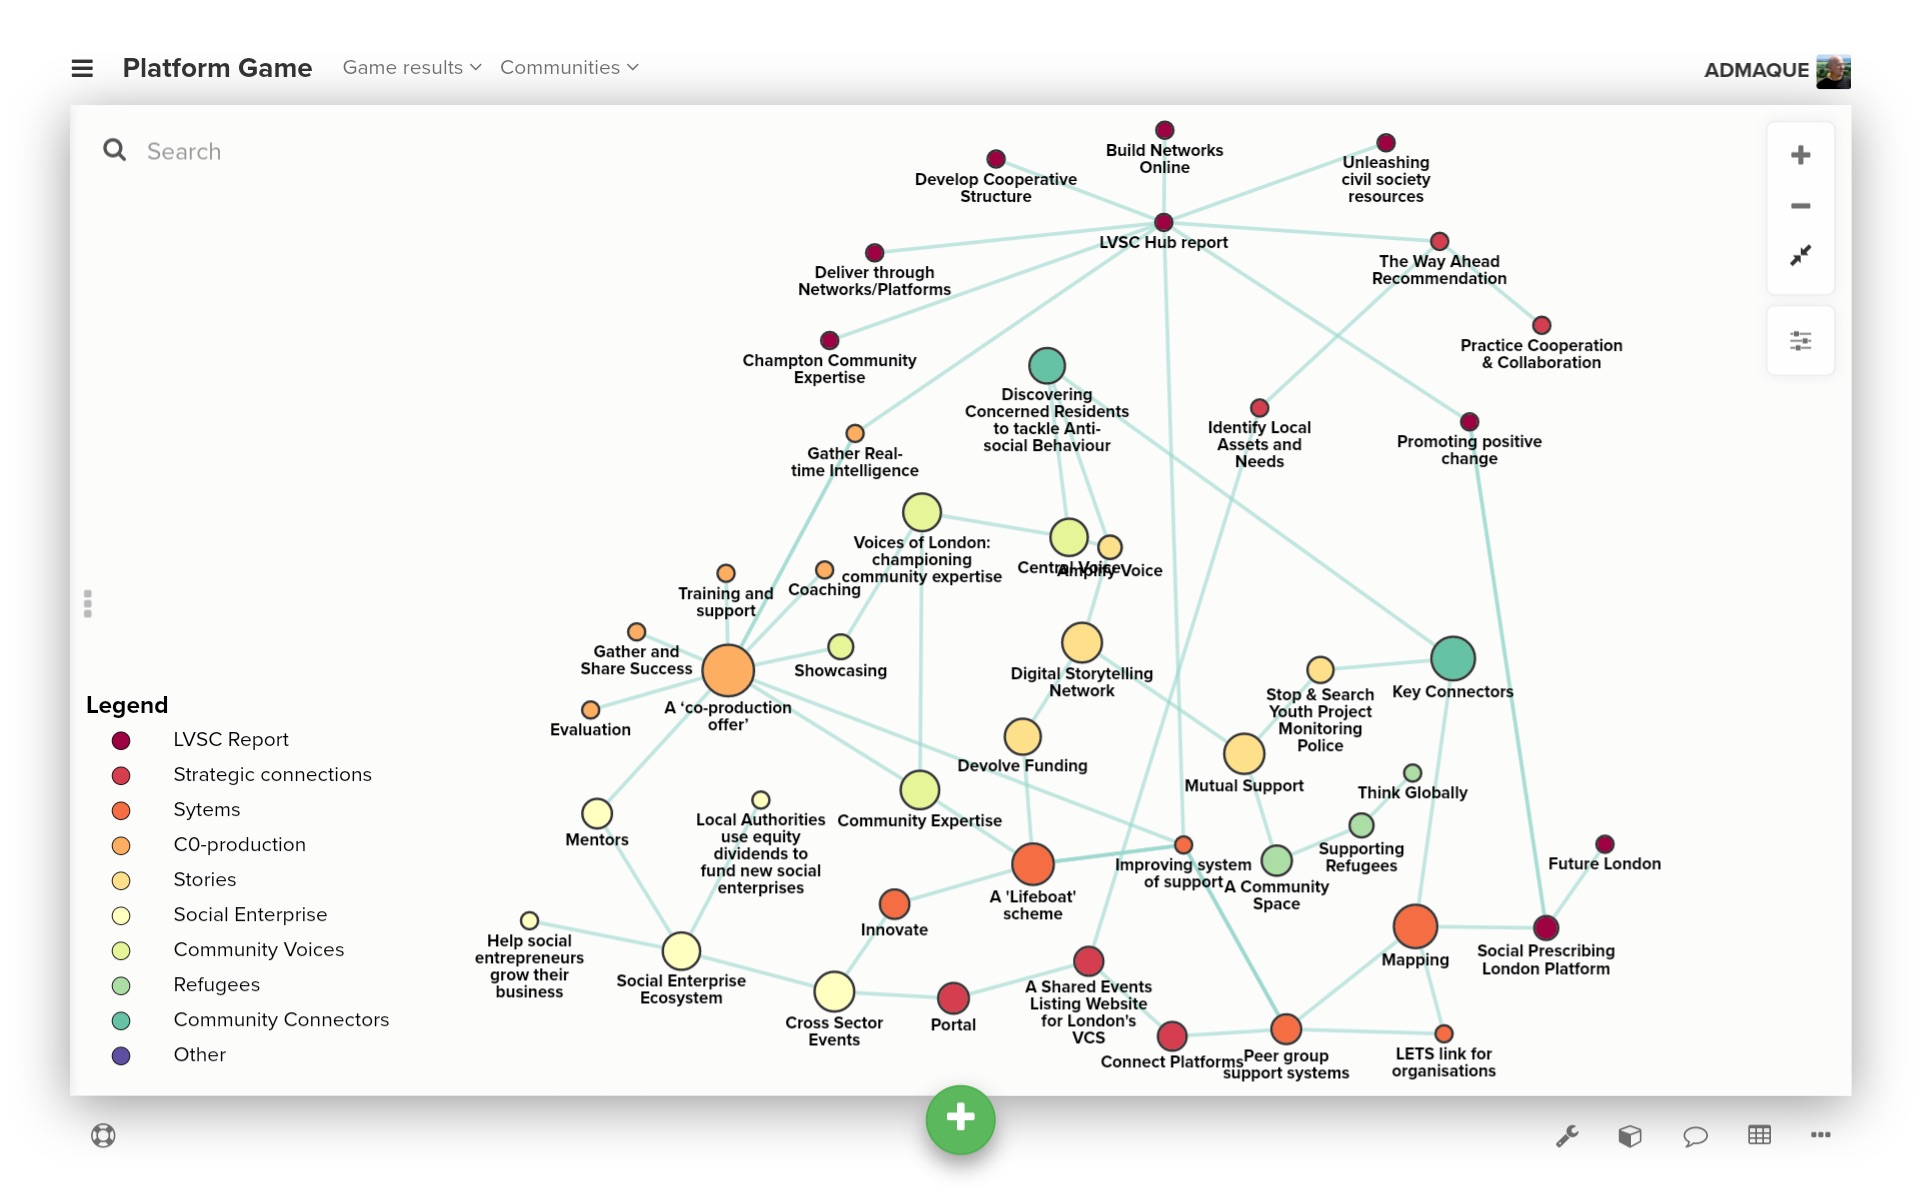
| These are screenshots and analysis of the interactive map, above. | These are screenshots and analysis of the interactive map, above. | ||
| - | First, here's the way that the [Kumu.io software](https://kumu.io), used to draw the original map, shows clusters. See the legend for cluster descriptions. [Diagram here](http://socialreporter.co.uk.s3.amazonaws.com/images/cluster3.jpg) | + | First, here's the way that the [Kumu.io software](https://kumu.io), used to draw the original map, shows clusters. See the legend for cluster descriptions. |
| + | {{:hubgame:cluster3.jpg?800|}} | ||
| + | |||
| - |  | ||
| ## Table analysis clusters | ## Table analysis clusters | ||
| - | This table shows how ideas and methods cluster around key nodes, coloured pink in the table. [Diagram here](http://socialreporter.co.uk.s3.amazonaws.com/images/cluster2.jpg) | + | This table shows how ideas and methods cluster around key nodes, coloured pink in the table. |
| - | 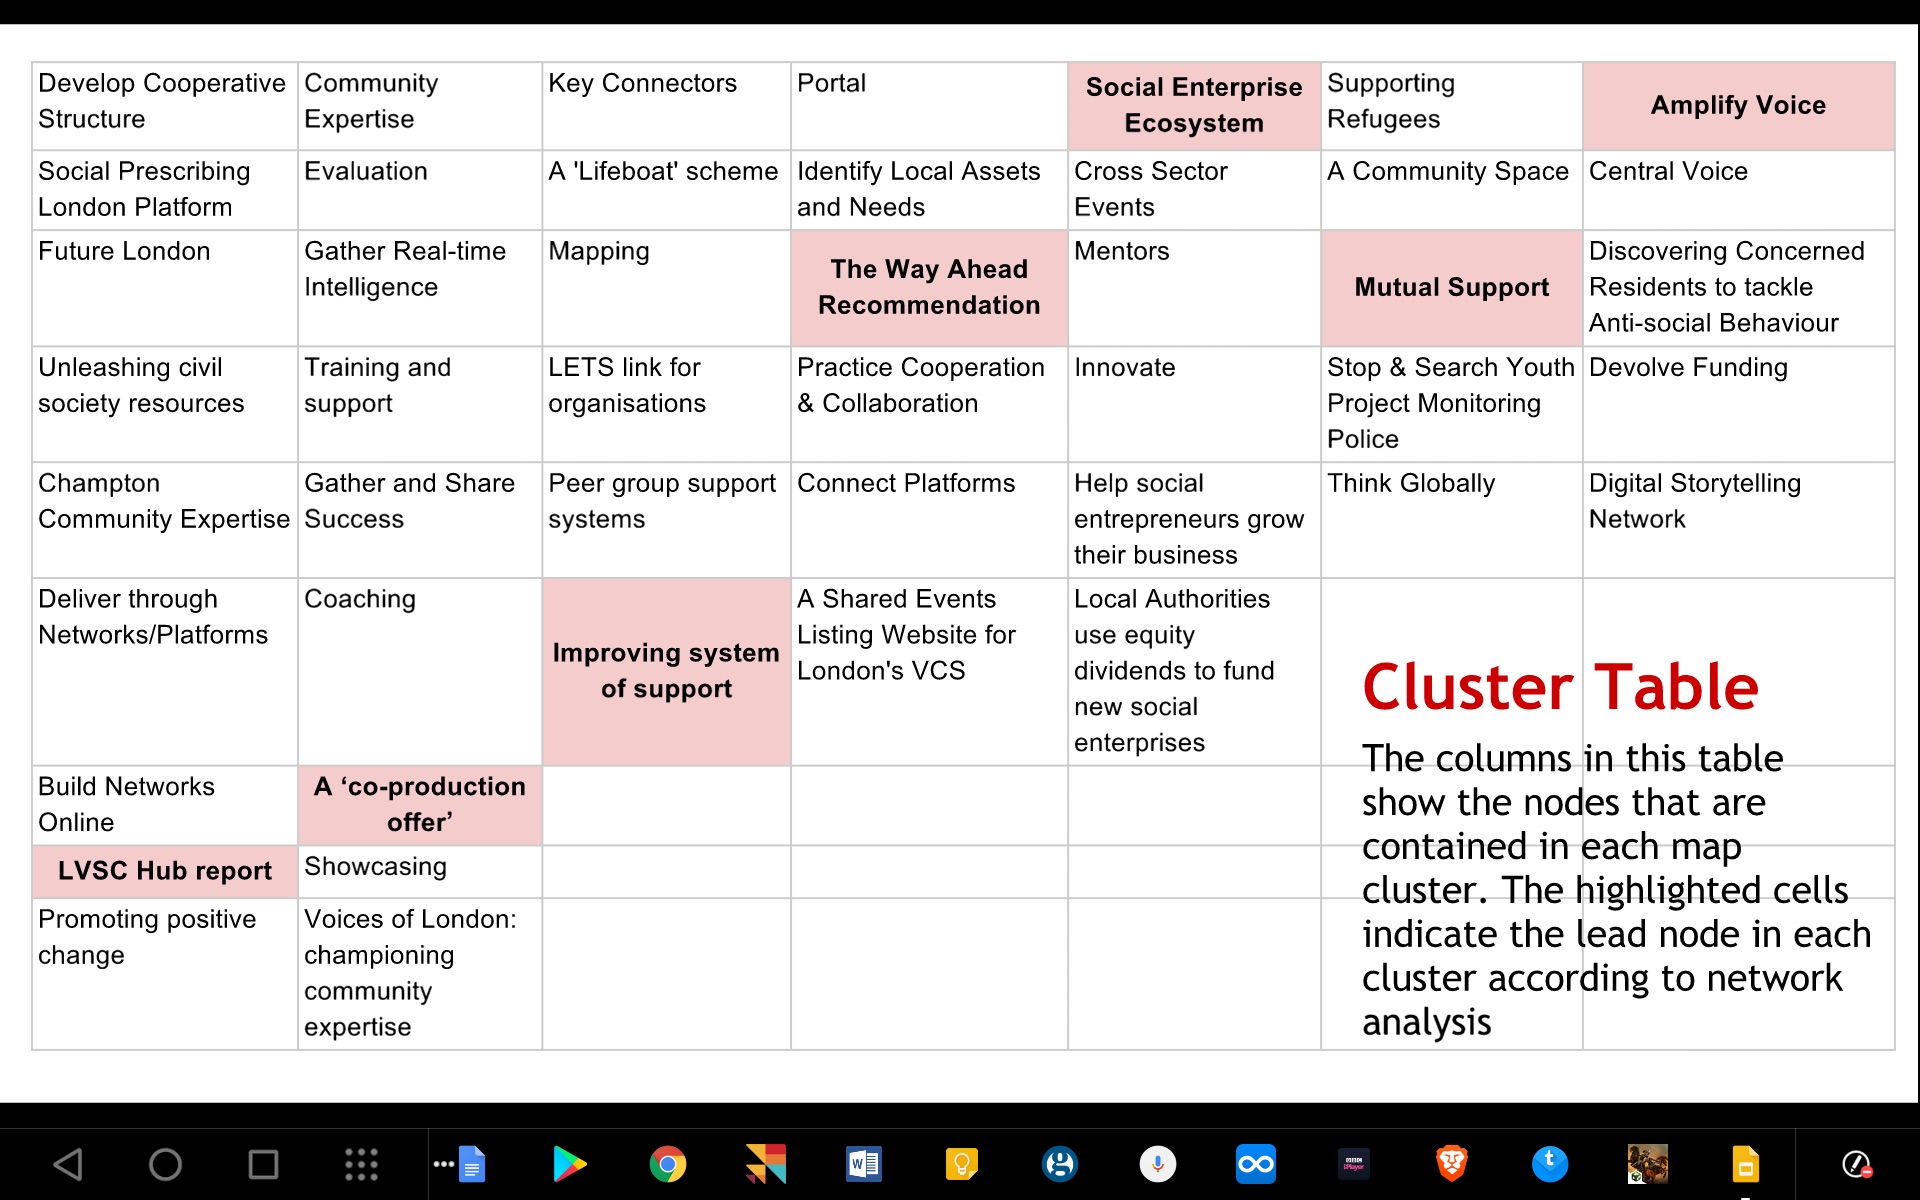 | + | {{:hubgame:cluster2.jpg?800|}} |
hubgame/map.1654088498.txt.gz · Last modified: 2022/06/01 13:01 by 2yf7j
Page Tools
Except where otherwise noted, content on this wiki is licensed under the following license: CC Attribution-Noncommercial-Share Alike 4.0 International


